Unit 4: Topic2: Writing
Domain and Range of Relations from their Graphs
Competencies
· Sketch graphs of
relations
· Determine the
domain and range of relations from their graphs
Suggested ways of teaching this topic: Guided Practice
Starter Activities
The teacher
may start with asking questions of the following type:
“Who can
define relations?”
“Who will tell
us what domain means?”
“What about
range?”
Expected Answers:
A relation is
a set of ordered pairs
The domain is
the set of 1st coordinates of the ordered pairs.
The range is
the set of 2nd coordinates of the ordered pairs.
After the
definitions are revised, the teacher may ask students to come up with answers
to questions of the following type:
Given the
relations: R1= {(3,2), (1,6), (-2,0)} and R2= {(2, 4),
(3,-1), (0,-4), (3, 4)}find the domain and range of each relation.
Expected Answers:
For R1 , Domain = {3, 1, -2} and Range = {2, 6, 0}
For R2 , Domain = {2, 3, 0} and Range = {4, -1, -4}
Example 1: What is the domain of the relation {(2, 1), (4, 2), (3, 3), (4, 1)}
- {2, 3, 4, 4}
- {1, 2, 3, 1}
 {2, 3, 4}
- {1, 2, 3}
- {1, 2, 3, 4}
Example 2: What is the range of the relation {(2, 1), (4, 2), (3, 3), (4, 1)}?
- {2, 3, 4, 4}
- {1, 2, 3, 1}
- {2, 3, 4}
 {1, 2, 3}
- {1, 2, 3, 4}
After a short summary on the definitions
of domain and range of relations, the teacher may continue the discussion,
using appropriate examples of type given below, to answer the important question:
“How could we determine the domain and range of relations with two or more
inequalities?” (The graphs could be graphs of those relations discussed in
Topic 4 above.
Major Idea:
To determine domain and range of
relations with two or more inequalities, it is better to sketch their graph and
see the region covered by the relation both horizontally and vertically.
The teacher may start with those graphs
of relations with only one boundary line and continue with relations with two
or more inequalities.
Lesson Notes
Example: Determine the
domain and range of relations represented by the graphs given below
|
a)
|
b)
|
c) |
d)
|
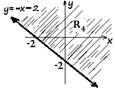
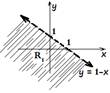
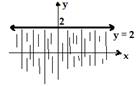
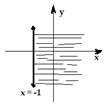
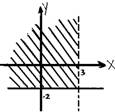
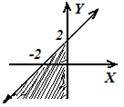
Solution:
a) Since the border
line goes non-stop on both directions, there is no limit to the relation
(shaded region) vertically and horizontally. Thus, the domain and range of this
relation is the set of all real numbers
b) Same as in a)
c) As the boundary
line does not limit the shaded region horizontally, the domain of the relation
is the set of real numbers. But, as the boundary line limits the relation
vertically at y = 2 and the line y = 2 is a solid one, the range of the
relation is given by {y: y![]() 2}.
2}.
d) As the boundary
line limits the relation horizontally at x = -1 and the line is solid, the
domain of the relation is given by {x: x ![]() -1} But, as the boundary line
does not limit the shaded region horizontally, the range of the relation is the
set of real numbers.
-1} But, as the boundary line
does not limit the shaded region horizontally, the range of the relation is the
set of real numbers.
CONCLUSION
The teacher
might ask students to conclude on the domain and range of the relations given by
graphs of type a) and b) above. The students are expected to conclude as
follows:
If the relation
is represented by a graph with shaded region above or below one boundary line
which is neither vertical nor horizontal straight line, the domain and range of
the relation will be the set of all real numbers.
Example: Determine the
domain and range of the relations represented by the graphs below.
|
a)
|
b)
|
c)
|
d) |
Solution:
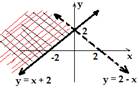
a)
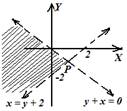
Since the boundary lines y = 2 – x and y = x + 2 meet
at (0, 2), with y= 2 – x a broken line, and the shaded region is limited
horizontally to the right by the line x = 0, the domain of the relation is {x:
x < 0}. But, as the region is not limited vertically, the range of the
relation is the set of all real numbers.
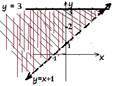
b)
The first step is to determine the intersection
point of the boundary lines. To get that, we can solve both equations
simultaneously using substitution method. Thus, substituting the value of y = 3
into y= x +1, we get 3 = x +1, which gives x = 2. So, the intersection point of
the boundary lines is at (2, 3).
When we see the shaded region, it is limited horizontally to the right by
the line x = 2, with the line y = x + 1 broken. So, the domain of the relation
is {x: x < 2}. The shaded region is also limited vertically upwards by the
solid line y = 3. So, the range of the relation is {y: y ![]() 3}.
3}.
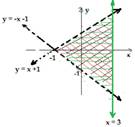
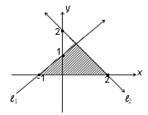
c)
Observing the shaded region, we see that it is
triangular form, where it is bounded horizontally as well as vertically from
both directions. Horizontally, the region is bounded by a broken line x = -1
from the left and by a solid line x = 3 from the right. Thus, the domain of the
relation is {x: - 1 < x ![]() 3}. To get the boundary lines which limited the
shaded region vertically, we need to find the intersection points of x = 3 with
the line y = x + 1 and y = - x -1. This can be done by substitution. If we
substitute x = 3 in y = x + 1and y = - x -1, we get y = 4 and y = - 4 respectively. Therefore,
the range of the relation is {y: -4 <
y < 4}.
3}. To get the boundary lines which limited the
shaded region vertically, we need to find the intersection points of x = 3 with
the line y = x + 1 and y = - x -1. This can be done by substitution. If we
substitute x = 3 in y = x + 1and y = - x -1, we get y = 4 and y = - 4 respectively. Therefore,
the range of the relation is {y: -4 <
y < 4}.
Note:
Students must
be reminded about the type of relationship between the strict less or greater
symbols and broken the lines as well as why that relationship existed.
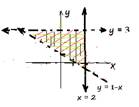
d)
This shaded region is also in a triangular shape,
bounded both horizontally and vertically. We need the intersection points of
the lines x = 2 and y = 3 with the line y = 1– x. So, substitution results in y
= -1 and x = – 2 respectively. So, the intersection points are (-2, 3) and (2,
-1). Thus, the domain of the relation is {x: -2 < x < 2} and its rangeis {y: -1 < y < 3}.
Concluding Activities
As discussed
above, determining the domain and range of relations given their graphs is to
see where the relation is limited vertically or horizontally or both. Students
must be given relations without graphs, say R = {(x, y): y £ x - 2, y< -x+3 and y > -4}, and shall be asked to determine the domain and range. (Of course, they
need to sketch graphs!).Therefore, the teacher shall make sure that students
have become capable of sketching graphs of relations and can write the domain
and range from the graphs giving them relations of the
above type and guiding them to practice and master the skills.
Practice
Exercises
1.
Write
the inequality represented by each of the following graphs and determine their
domain and range
|
a)
|
b)
|
c)
|
d) |
2.
Sketch
the graphs of the following relations and determine their domain and range.
A. R = {(x, y): y
> x -1 and x > 2}
B. R = {(x, y): x +
y ≤ 2 and y < x}
C. R = {(x, y): y
≤ x + 1, x + y ≥ -2 and x < 2}
D.
R
= {(x, y) = y <x + 2 and x + y < 0}
E.
R
= {x, y) = x<y+2 and y +x < 0}