Unit 4: Relations and Functions
Topic 1: Sketching Relations with Two or More Inequalities
Competencies
·
Sketch graphs of relations
·
Identify the domain and range of a relation.
·
Show relations as mappings and sets.
Suggested ways
of teaching this topic: Guided
Practice
Starter Activities
Before discussing how to sketch graphs of relations with inequalities,
the teacher could remind students the different methods of representing a
relation using an example of the following type:
Example: How could we show the relation {(2,1), (-1,3),
(0,4)} in different ways?
Solution:
It can be
shown by:
1)
A table.
|
x |
2 |
-1 |
0 |
|
y |
1 |
3 |
4 |
2)
A mapping.
3)
A graph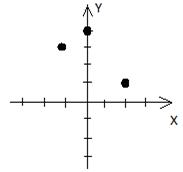
Lesson Notes
The teacher should also have to make sure that students know how to
sketch graphs of straight lines, which will be vital in sketching graphs of
relations with inequalities, by asking students to sketch the graphs of some
lines of the following type:
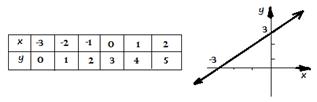
Example 1: Sketch the graph of the following functions:
A.
y = x + 3
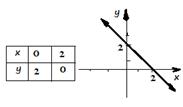
B.
y = 2 – x
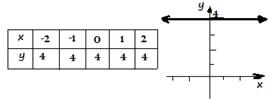
C.
y = 4
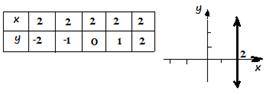
D.
x = 2
Solution: To sketch the graphs of these lines, it is possible to start with a table
of values or finding x and y-intercepts –both of which students are familiar
with at lower grades.
a)
y = x + 3
b)
y = 2 – x
c)
y = 4
d)
x = 2
Now, it is the time to introduce graphs of relations with one inequality
and step by step to two or more inequalities. Though students might not show
it, grade 9 students are familiar with graphs of simple relations with one
inequality at lower grades. Thus, it might be sufficient to give them some
relations, of the following type, which could be done in pairs or small groups.
Example 2: Sketch the graphs of each of the following relations:
A.
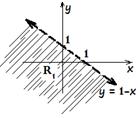
R1 = {(x, y): y <1 - x}
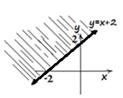
B.
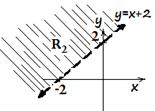
R2 = {(x, y): y > x + 2}
C.
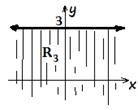
R3 = {(x, y): y ![]() 3}
3}
D.
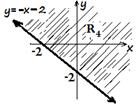
R4 = {(x, y): y ![]() - x - 2}
- x - 2}
Solution:
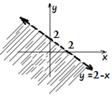
A.
At the beginning, we need to find the boundary line.
That is, y = 1 – x. (Remember the
inequality is strict less! So, the line must be broken) Then, we need to decide
which way to shade. This can be checked by taking the origin, (0, 0) in to the inequality. For y <1 – x, if we substitute (0, 0)![]() we get 0 <1,which is true. Thus, we shade below
the line y = 1 – x, towards the
origin.
we get 0 <1,which is true. Thus, we shade below
the line y = 1 – x, towards the
origin.
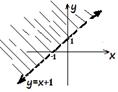
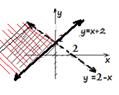
B.
Here, the boundary line is, y = x + 2. As the inequality is strict greater, the line must be broken.
Then, we need to decide which way to shade. This can be checked by taking the
origin, (0, 0) in to the inequality. For y >x + 2, if we substitute (0, 0)![]() we get 0 >2,which is false.
Thus, we shade above the line y = x + 2, opposite
to the origin.
we get 0 >2,which is false.
Thus, we shade above the line y = x + 2, opposite
to the origin.
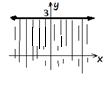
C.
In R3, the boundary line is, y = 3. As the
inequality includes equality, the line must be solid. Then, we need to decide
which way to shade. This can be checked by taking the origin, (0, 0) in to the inequality. For y ![]() 3, if we substitute (0, 0)
3, if we substitute (0, 0)![]() we will get0
we will get0![]() 3,which is true. Thus, we shade below the
line y = 3, towards to the origin.
3,which is true. Thus, we shade below the
line y = 3, towards to the origin.
D.
In this case, the boundary line is, y = - x - 2. As the inequality includes
equality, the line must be solid. Then, we need to decide which way to shade.
This can be checked by taking the origin, (0, 0) in to
the inequality y ![]() - x – 2. If we substitute (0, 0)
- x – 2. If we substitute (0, 0)![]() we will get0
we will get0![]() ,which is true. Thus, we shade
below the boundary line y
,which is true. Thus, we shade
below the boundary line y ![]() - x - 2, towards to the origin.
- x - 2, towards to the origin.
Example 3: Sketch the graphs of each of the following relations:
a)
R1 = {(x, y): y >x + 1 and y ![]() 3}
3}
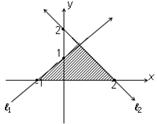
b)
R2 = {(x, y): y ![]() x + 2 and y< -x +2}
x + 2 and y< -x +2}
c)
R3 = {(x, y): y >1 – x, x![]() and y <3}
and y <3}
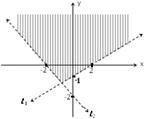
d)
R4 = {(x, y): y> - x -1, y<
x + 1 and x![]() 3}
3}
Solutions:
a)
 Here, we have two boundary lines. y =
x+1 and y = 3. Since the first inequality is strict less and the second
includes equality, y = x+1 must be
broken and y = 3 must be solid. To decide which way to shade, we can check both
inequalities, one by one, taking the origin, (0, 0).
Here, we have two boundary lines. y =
x+1 and y = 3. Since the first inequality is strict less and the second
includes equality, y = x+1 must be
broken and y = 3 must be solid. To decide which way to shade, we can check both
inequalities, one by one, taking the origin, (0, 0).
For y >x +
1, if we substitute (0, 0)![]() we get 0 >1, which is false.
Thus, we shade above the line y = x+1, opposite
to the origin, as shown.
we get 0 >1, which is false.
Thus, we shade above the line y = x+1, opposite
to the origin, as shown.
 For y
For y ![]() 3, if we substitute (0, 0)
3, if we substitute (0, 0)![]() we get 0
we get 0 ![]() 3, which is true. Thus we shade below y = 3, towards the origin.
3, which is true. Thus we shade below y = 3, towards the origin.
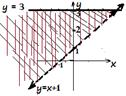 Since R1is a relation with two inequalities joined by “and”,
we will sketch both graphs on one co-ordinate plane and take the intersection
of the two regions, as shown below.
Since R1is a relation with two inequalities joined by “and”,
we will sketch both graphs on one co-ordinate plane and take the intersection
of the two regions, as shown below.
b)
Here, we have two boundary lines. y![]() x+ 2 and y = -x +2. Since the
first inequality includes equality and the second inequality is strict less, y
x+ 2 and y = -x +2. Since the
first inequality includes equality and the second inequality is strict less, y ![]() x+ 2must be a solid line and y = -x +2must be broken. To decide which
way to shade, we can check both inequalities, one by one, taking the origin,
(0, 0).
x+ 2must be a solid line and y = -x +2must be broken. To decide which
way to shade, we can check both inequalities, one by one, taking the origin,
(0, 0).
 For y
For y ![]() x + 2, if we substitute (0, 0)
x + 2, if we substitute (0, 0)![]() we get 0
we get 0 ![]() 2, which is false. Thus, we
shade above the line y = x+2, opposite
to the origin, as shown.
2, which is false. Thus, we
shade above the line y = x+2, opposite
to the origin, as shown.
 For y< -x +2, if we substitute (0, 0)
![]() we get 0 < 2, which is true.
Thus we shade below y = - x+2, towards
the origin.
we get 0 < 2, which is true.
Thus we shade below y = - x+2, towards
the origin.
Since R2is a relation with two
inequalities joined by “and”, we will take the intersection of the two shaded
regions after graphing both on one co-ordinate plane.
c)
In R3, there are three boundary lines: y
= 1 – x, x = 2 and y = 3. As the first and the last inequalities
are strict, both lines y = 1 – x and y = 3 shall be solid. But, since the
second includes equality the line x = 2must
be solid.
·
For y >1 –
x, if we substitute (0, 0)![]() we get 0
we get 0 ![]() 1, which is false. Thus, we
shade above the line y =1 – x, opposite
to the origin.
1, which is false. Thus, we
shade above the line y =1 – x, opposite
to the origin.
·
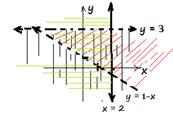 Forx
Forx![]() , whenwe substitute (0, 0)
, whenwe substitute (0, 0)![]() we get 0
we get 0![]() which is true. Thus, we shade
towards the origin, to the left of x = 2.
which is true. Thus, we shade
towards the origin, to the left of x = 2.
·
For y ![]() 3, if we substitute (0, 0)
3, if we substitute (0, 0)![]() we get 0
we get 0 ![]() 3, which is true. Thus we shade below y = 3, towards the origin.
3, which is true. Thus we shade below y = 3, towards the origin.
·
Since
R3 is a relation with three inequalities joined by “and”, we will take the
intersection of the three shaded regions after graphing both on one co-ordinate
plane, as shown.
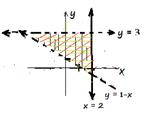
·
The final regionR3 will be the one shown
below.
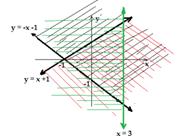
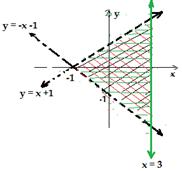
d)
In this case, there are three boundary lines. They
are: y = - x –1, y = x +1 and x = 3. As the first and second
inequalities are strict, the linesy = - x –1 and y = x +1 must be broken.
The third inequality includes equality, the line must be solid. Then, we need
to decide which way to shade. This can be checked by taking the origin, (0, 0) in to the inequalities.
·
Fory > - x – 1, if we
substitute (0, 0)![]() we will get 0>
we will get 0>![]() , which is true. Thus, we shade
above the boundary line y
, which is true. Thus, we shade
above the boundary line y ![]() - x - 1, towards to the origin.
- x - 1, towards to the origin.
·
For y < x +1,if we substitute
(0, 0)![]() we will get 0<
we will get 0<![]() , which is true. Thus, we shade
below the boundary line y
, which is true. Thus, we shade
below the boundary line y ![]() x +1, towards to the origin.
x +1, towards to the origin.
·
For x![]() 3,ifwe substitute (0, 0)
3,ifwe substitute (0, 0)![]() we will get 0
we will get 0![]() 3, which is true. Thus, we shade towards
the origin – to the left of the line x =
3.
3, which is true. Thus, we shade towards
the origin – to the left of the line x =
3.
·
The final regionR4 will be the one shown
below.
Practice Exercises
1.
Sketch
the graphs of the following relations
A.
R
= {(x, y): x + y < 2 and y < x}
B.
R
= {(x, y): y > x -1, y > - x – 3 and
y < 4}
C.
R
= {(x, y): y ≤ x + 1, x + y ≥ -2 and x < 2}
2.
Write
the inequality represented by each of the following graphs