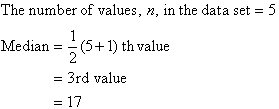
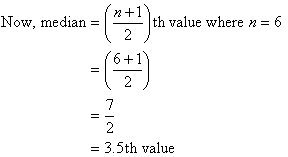
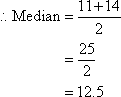
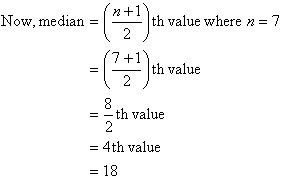
Unit 6: Statistics and Probability
Topic 1: Variance and Standard Deviation
Competencies
· Determine the
variance of a given statistical data
· Find the
standard deviation of a given data
Suggested ways
of teaching this topic: Q &A and Guided Discovery
Starter
Activities
The teacher could start with the revision
of previous lessons on the measures of Central Tendency – Mean, Median and Mode
using Q & A, asking questions like:
·
What
is statistics?
·
What
do we mean by population? Sample?
·
What
are the measures of Central Tendency?
·
How
can we find each measure of central Tendency? Show the steps using examples.
Expected Replies
A population is the whole set of items from which a data sample can be drawn; so a sample is only a portion of the population data. Features of a sample are described by statistics.
Standard
Deviation and Variance
The variance and the closely-related
standard deviation are measures of how spread out a distribution is. In other
words, they are measures of variability or dispersion.
The variance is computed as the average squared deviation of each number from
its mean. For example, for the numbers 1, 2, and 3, the mean is 2 and the
variance is:
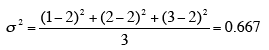 .
.
The
formula (in summation notation) for the variance in a population is
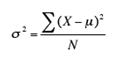 Where
μ is the mean and N is the number of scores.
Where
μ is the mean and N is the number of scores.
When
the variance is computed in a sample, the statistic
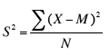 (where M is the
mean of the sample) can be used. S² is a biased estimate of σ².
(where M is the
mean of the sample) can be used. S² is a biased estimate of σ².
However,
by far the most common formula for computing variance in a sample is:
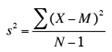 which gives an
unbiased estimate of σ².
which gives an
unbiased estimate of σ².
Since
samples are usually used to estimate parameters, s² is the most commonly used
measure of variance. Calculating the variance is an important part of many
statistical applications and analyses. It is the first step in calculating the
standard deviation.
Standard
Deviation
The
standard deviation formula is very simple: it is the square root of the variance. It is the most
commonly used measure of spread. The standard deviation has proven to be an
extremely useful measure of spread in part because it is mathematically controllable.
Many formulas in inferential statistics use
the standard deviation.
Example:
Find
the variance and standard deviation, to one decimal place, of population
function whose distribution is given below.
|
Values |
1
3 5 7
9 |
|
Frequency |
2
3 2 3
2 |
Solution:
Step 1) ![]() =
= ![]() =
= ![]() = 5
= 5
|
|
Value
|
1 |
3 |
5 |
7 |
9 |
|
Step
2) |
xi - |
1-5 |
3-5 |
5-5 |
7-5 |
9-5 |
|
Step
3) |
(
xi - |
(-4)2 |
(-2)2 |
(0)2 |
(2)2 |
(4)2 |
|
|
Frequency
|
2 |
3 |
2 |
3 |
2 |
|
Step
4) |
fi ( xi - |
2(-4)2 |
3(-2)2 |
2(0)2 |
3(2)2 |
2(4)2 |
Step 5) Variance = d2 =![]()
= ![]()
Step 6) Standard
deviation = d
= ![]() » 2.7
» 2.7
Example:Find the variance
and standard deviation to one decimal place, of the population function whose
distribution is given below.
|
Values
|
1
2 3 4
5 |
|
Frequency
|
3
3
1 1 4 |
Solution:
Step 1) ![]() =
= ![]() =
= ![]() =
= ![]() = 3
= 3
|
|
Value
|
1 |
2 |
3 |
4
|
5 |
|
Step
2) |
xi
- |
1-3 |
2-3 |
3
- 3 |
4
- 3 |
5-3 |
|
Step
3) |
(xi
- |
(-2)2 |
(-1)2 |
(0)2 |
(1)2 |
(2)2 |
|
|
Frequency
|
3 |
3 |
1 |
1 |
4 |
|
Step
4) |
fi (xi - |
3
(-2)2 |
3(-1)2 |
1(0)2 |
1(1)2 |
4(2)2 |
Step 5) Variance
= d2 =![]()
= ![]()
![]() 2.7
2.7
Step 6) The
standard deviation
d = ![]() » 1.6 to one decimal place.
» 1.6 to one decimal place.
Practice
Exercises
1.
For
the numbers 1, 2, 4, 4, 5, 8; find
i)
their
mean, median and mode
ii)
the
range, variance and standard deviation
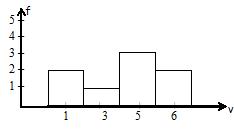
2.
Given
the following distribution table, find
i)
the
measures of central tendency
ii) the measures of
dispersion
iii) the histogram
that represents the distribution
|
v |
2 |
4 |
6 |
7 |
10 |
|
f |
6 |
2 |
3 |
6 |
1 |
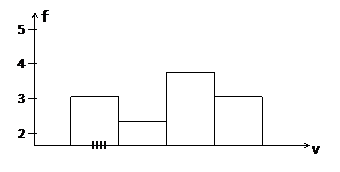
3.
Use
the given histogram to find the mean, median, mode, range, mean deviation,
variance and standard deviation of the population function.